- Giáo dục
- ट्रेडिंग रणनीतियाँ
- Parabolic SAR: बाजार के ट्रेंड मोमेंटम को ट्रैक करना
Parabolic SAR: बाजार के ट्रेंड मोमेंटम को ट्रैक करना
यह समझना कि कोई ट्रेंड कब जारी रहेगा या कब उलट सकता है, आपकी ट्रेडिंग में बड़ा फर्क डाल सकता है। Parabolic SAR (Stop and Reverse) एक सरल टूल है जो ट्रेंड की दिशा और संभावित एंट्री या एग्जिट पॉइंट्स के विज़ुअल सिग्नल देता है। अन्य इंडिकेटर्स के विपरीत, यह कीमत के साथ “छाया” की तरह चलता है और रियल-टाइम में मार्केट मोमेंटम दिखाता है।
- Parabolic SAR क्या है?
- ट्रेंडिंग मार्केट में ट्रेडर्स इस पर क्यों भरोसा करते हैं
- Parabolic SAR से ट्रेड कैसे करें
- SAR की सीमाएँ
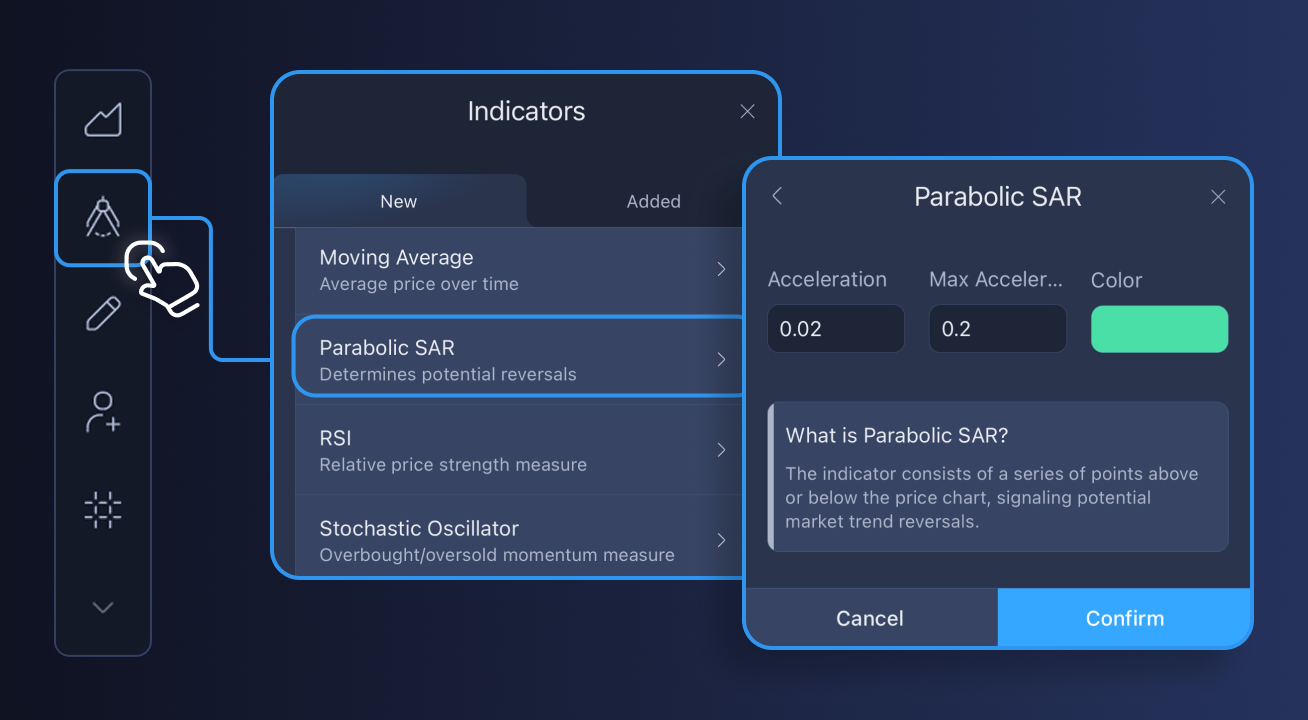
Parabolic SAR क्या है?
J. Welles Wilder द्वारा विकसित Parabolic SAR को कीमत के मोमेंटम को ट्रैक करने और संभावित टर्निंग पॉइंट्स को पहचानने के लिए डिज़ाइन किया गया है। चार्ट पर यह कीमत के साथ चलने वाले डॉट्स के रूप में दिखाई देता है — जैसे बाजार की दिशा बताने वाले पदचिह्न।
- कीमत के नीचे डॉट्स: अपट्रेंड जारी है — बुलिश मोमेंटम
- कीमत के ऊपर डॉट्स: डाउनट्रेंड जारी है — बेयरिश मोमेंटम
- कीमत का डॉट्स को क्रॉस करना: संभावित ट्रेंड रिवर्सल या ठहराव
यह सरल, विज़ुअल और प्रभावी है — खासकर ट्रेंड-फॉलोइंग रणनीतियों में।
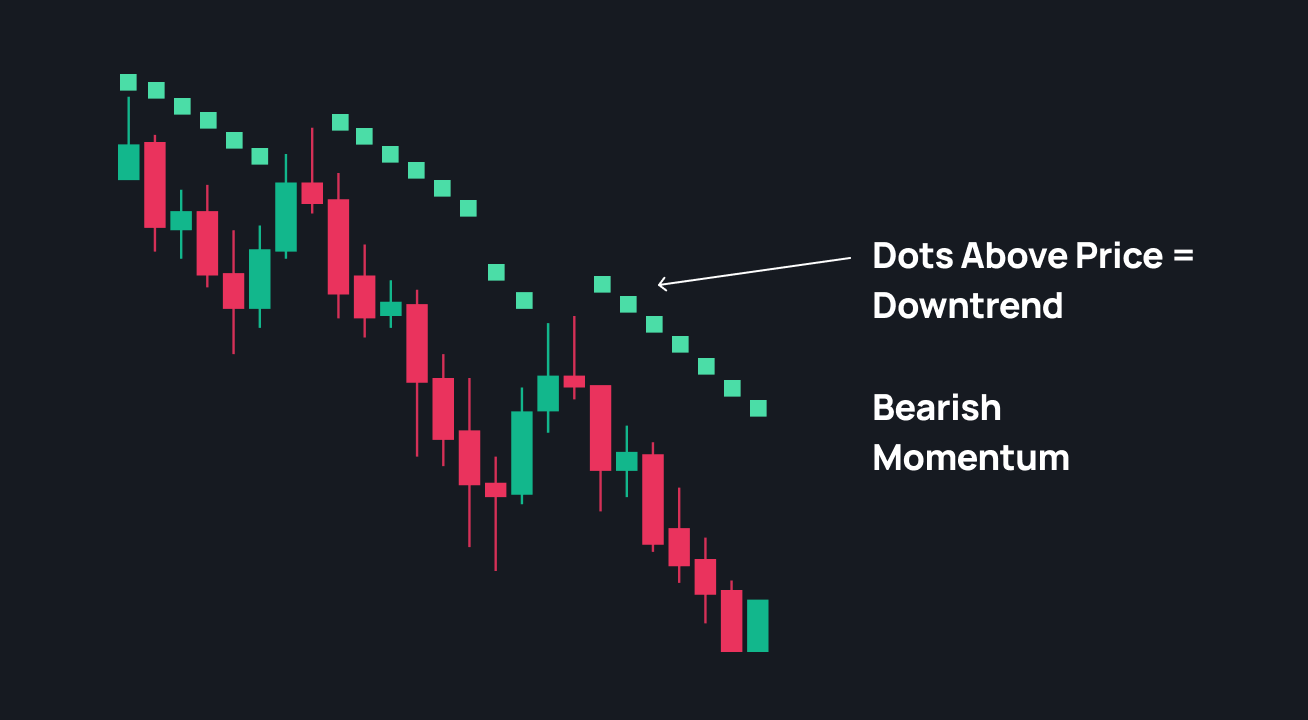
ट्रेंडिंग मार्केट में ट्रेडर्स इस पर क्यों भरोसा करते हैं
Parabolic SAR तब सबसे अच्छा काम करता है जब मार्केट की दिशा स्पष्ट होती है:
- अपट्रेंड में कीमत आमतौर पर डॉट्स के ऊपर रहती है, जिससे लॉन्ग पोज़िशन बनाए रखने में मदद मिलती है
- डाउनट्रेंड में कीमत डॉट्स के नीचे रहती है, जिससे शॉर्ट अवसरों की पहचान होती है
SAR कीमत के साथ डायनामिक रूप से एडजस्ट होता है, इसलिए यह बिल्ट-इन ट्रेलिंग स्टॉप की तरह काम करता है और ट्रेंड जारी रहने पर लाभ को सुरक्षित रखने में मदद करता है।
टिप: साइडवेज़ मार्केट में इसे अकेले इस्तेमाल करने से बचें — गलत सिग्नल अधिक हो सकते हैं। इसे ट्रेंड या मोमेंटम इंडिकेटर्स के साथ उपयोग करना बेहतर है।
Parabolic SAR से ट्रेड कैसे करें
ट्रेडर्स आमतौर पर SAR का उपयोग तीन तरीकों से करते हैं:
1. ट्रेंड को फॉलो करना
- जब डॉट्स कीमत के नीचे हों तो Call
- जब डॉट्स कीमत के ऊपर हों तो Put
यह सरल विज़ुअल सिग्नल आपको मोमेंटम के साथ ट्रेड करने में मदद करता है, उसके खिलाफ नहीं।
2. रिवर्सल पहचानना
जब कीमत SAR डॉट्स को क्रॉस करती है, तो यह ट्रेंड बदलने का संकेत हो सकता है। ट्रेडर्स इसे मौजूदा पोज़िशन बंद करने और दिशा बदलने के संकेत के रूप में उपयोग करते हैं।
3. ट्रेलिंग स्टॉप सेट करना
SAR डॉट्स कीमत के अनुसार अपने आप एडजस्ट होते हैं — इसलिए यह स्टॉप-लॉस सेट करने के लिए उपयोगी है। इससे लाभ सुरक्षित रहता है और अच्छे ट्रेड को लंबे समय तक होल्ड किया जा सकता है।
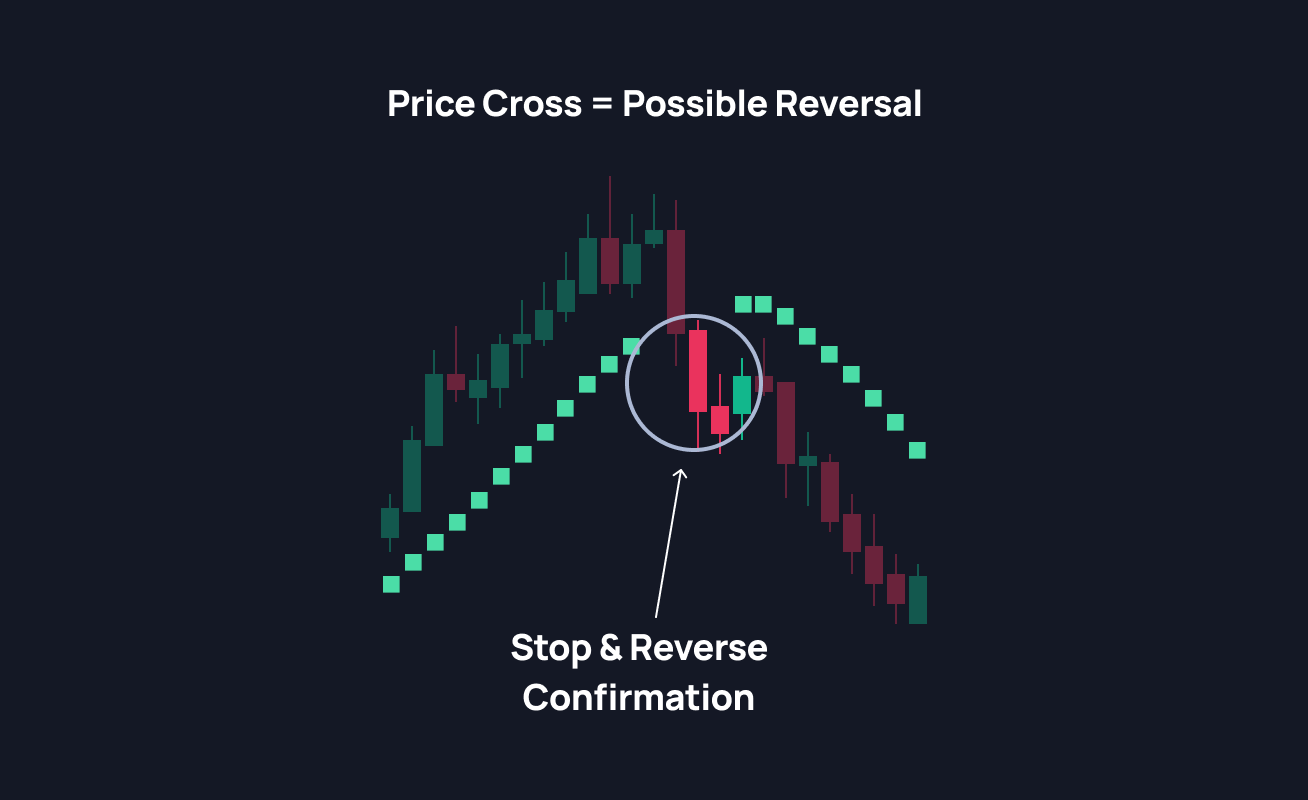
SAR की सीमाएँ
अन्य इंडिकेटर्स की तरह Parabolic SAR की भी कुछ सीमाएँ हैं:
- अस्थिर बाजारों में लैगिंग सिग्नल दे सकता है
- इसे अकेले उपयोग नहीं करना चाहिए, ट्रेंड या मोमेंटम इंडिकेटर्स के साथ बेहतर काम करता है
- कंसोलिडेशन में इसकी सटीकता कम हो सकती है और गलत सिग्नल मिल सकते हैं
इसीलिए अधिकतर ट्रेडर्स इसे एक सपोर्टिंग इंडिकेटर के रूप में उपयोग करते हैं, न कि अकेले निर्णय लेने वाले टूल के रूप में।
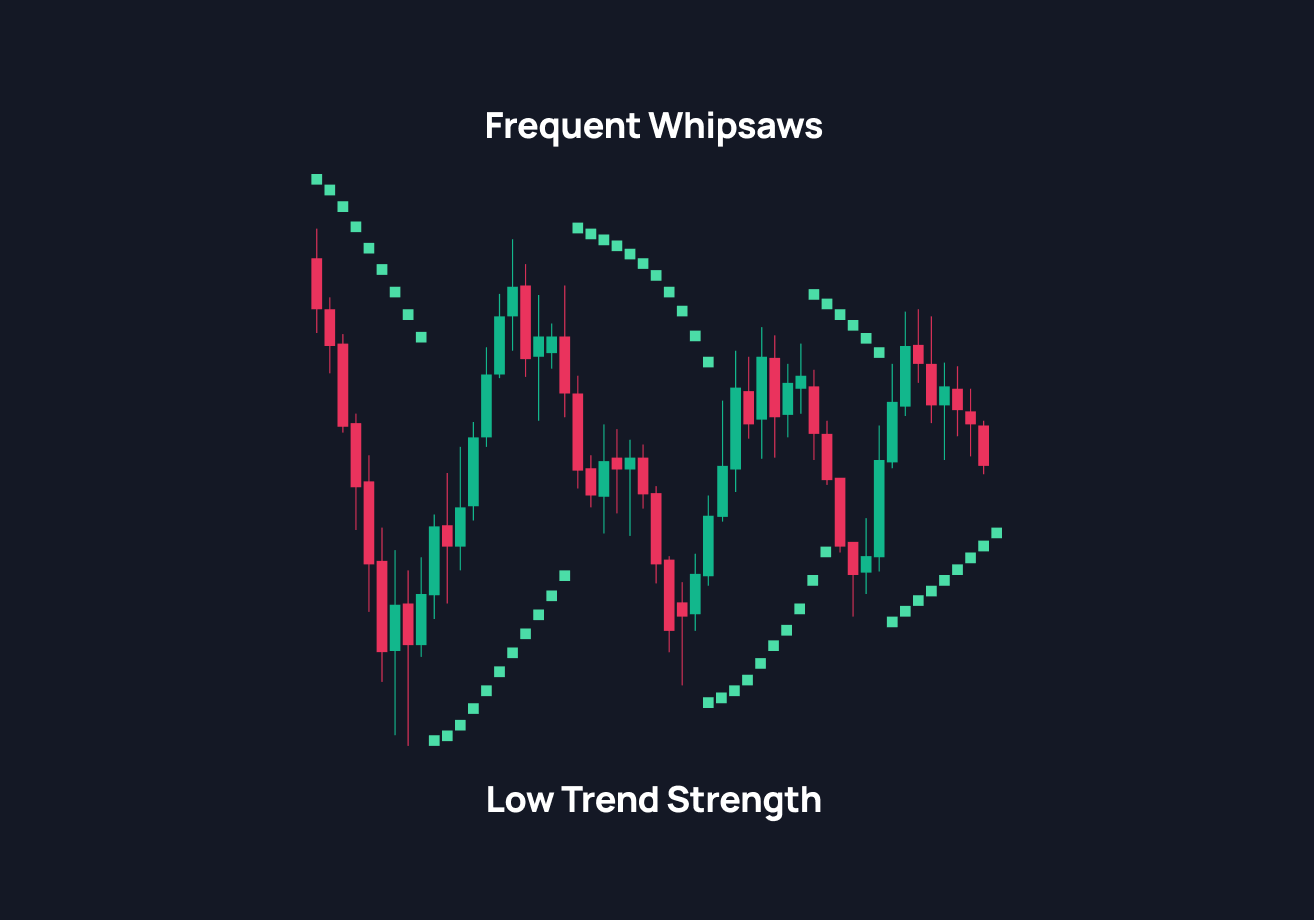
अपने एनालिसिस को मजबूत करने के लिए Parabolic SAR को इन इंडिकेटर्स के साथ जोड़ें:
- Moving Averages: समग्र ट्रेंड दिशा की पुष्टि
- RSI (Relative Strength Index): ओवरबॉट या ओवर्सोल्ड स्थिति पहचानना
- MACD: मोमेंटम बदलाव और संभावित रिवर्सल की पुष्टि
Parabolic SAR एक सरल लेकिन शक्तिशाली टूल है जो ट्रेंडिंग मार्केट में ट्रेड मैनेज करने में मदद करता है। यह बताता है कि कब होल्ड करना है, कब एग्जिट करना है, और कब मोमेंटम बदल रहा है।
चार्ट पर SAR को टेस्ट करें, अलग-अलग टाइमफ्रेम में प्रयोग करें और अपने पसंदीदा ट्रेंड या मोमेंटम इंडिकेटर्स के साथ इसे मिलाकर देखें। जितनी जल्दी आप रिवर्सल पकड़ते हैं और आत्मविश्वास के साथ ट्रेंड फॉलो करते हैं, उतनी ही आपकी ट्रेडिंग डिसिप्लिन मजबूत होती जाती है।